

Aloha!
QT IS HERE!
What is QT? It stands for Quantitative Tightening which is the opposite of QE (Quantitative Easing – discussed in previous Hawaii Damon newsletters) and it represents another foray by the Federal Reserve into completely uncharted economic waters the likes of which the Global Economy has never seen before. The US is leading the way but other countries will be following in different stages as their respective QEs end and their QTs begin (Europe, Japan etc.). It is basically the economic equivalent of Columbus embarking on a circumnavigation of the globe while at the time not having any idea of where he and his crew would eventually wind up. As with Columbus, the ultimate desired end to this foray would put us right back where we started – a sort of “Back to The Future” time travel to 2007 with the hindsight and ready-made policies to avert the 2008 Great Recession. QT could profoundly impact the real estate market and especially so here in Hawaii so please read on. (For lighter reading after this please check out last month’s August Hawaii Damon Newsletter showcasing the new Ward Village project. It includes lots of great pictures, video and virtual tour of what is being called “The Best Planned Community in the US.”)
First, let’s have a very quick summary review of our QE trip so far, where it all began and – most importantly – the results. As a consequence of the Great 2008 Recession the FED hammered interest rates to 0% in order stimulate the economy. Having completely exhausted the conventional monetary method to get the patient/economy breathing again, more extreme means to shock the economy back to life had to be tried. Enter QE and over the next 6.7 years the Fed bloated its balance sheet from $849 Billion to a whopping $4,474 Billion (~$4.5 Trillion which is a 427% increase) via the purchase of Treasuries (T-bills) and mortgage-back securities on the open market with the goal of:
1) injecting liquidity into the financial system,
2) suppressing long term interest rates (home mortgages etc.) and
3) removing the toxic assets from the balance sheets of banks, public and private institutions.
Where did the FED get get the money to purchase the above mentioned T-bills and securities? First, note that the FED has the mandate to increase what is called the M3 money supply as an economy grows allowing for a smooth transactional velocity of money (think of the game Monopoly where each new player entering the game gets $1,500 supply of money – the more players the bigger the money supply in the game). However, what the FED did this time was more akin to conjuring up money out of thin air to flood the M3 money supply. Here is what basically happened as a result of the money supply deluge:
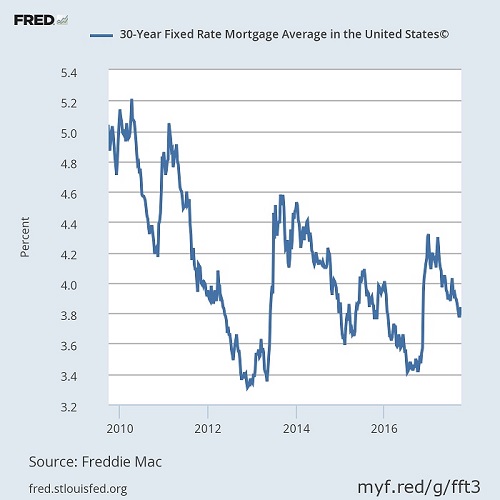
1) T-bill prices increased with the FED’s buying spree causing yields and home mortgage interest rates to decrease (T-bill prices and yields/interest rates are inversely correlated – see April Newsletter for a detailed explanation). 10 year T-bills compete with 30 year home mortgage interest rates causing the latter to also drop to historically low levels. Though mortgage interest rates have very slowly risen since last year they are still at historical lows. From this graph one can also see them dropping again in 2017 despite having the Fed Funds interest rate increasing by .75% since Dec. 2016.
2) As a result of 1) above the real estate market has been firing on all cylinders over the last several years in turn fueling a Sellers’ Market of increasing real estate prices especially here in Hawaii (with the exception of the Luxury Home markets which have been in a Buyers’ Market, a topic covered in previous Hawaii Damon Newsletters which can be found in the blog section of www.hawaiidamon.com).
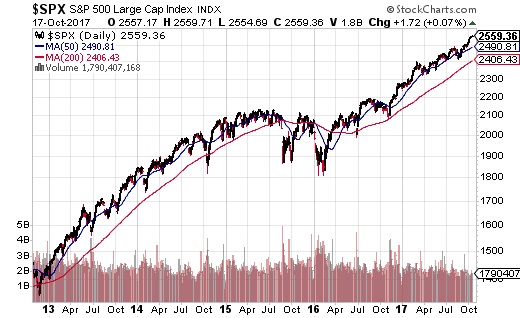
3) With such low interest rates companies in the US have embarked on a stock buy-back binge the equivalent of which we have never seen before. The US stock market (DOW, S&P 500, Nasdaq etc.) has been in an almost 45 degree rocket ascent for 8 years (see chart below) with almost all indexes (except Energy – Oil etc.) breaking new record highs. Yes, QE has been the foremost driver of the gains on almost everyone’s portfolios. Here is the 5 year S&P500 chart which basically speaks for itself:
4) GDP Growth – The economy has been finally growing, first at very anemic levels but then reaching 2.6% GDP growth in Q2 2017. Think of a giant and heavy cargo ship that takes up a lot of effort to get moving but once it gains momentum, short of an economic crash, it will continue to move forward.
5) Inflation – In a nutshell it is very tame. With the goal of getting to the “Goldilocks” zone of stoking 2+% inflation, we are not quite there. In the past economic age – with such a huge increase in M3 money supply – it has been theorized that we should be seeing Zimbabwe like inflation (many of my fellow Economists have been screaming like Chicken Little about inflation but so far the world has not fallen). We are in fact – in my humble opinion – experiencing a new economic paradigm in a global economy so integrated now thus antiquating a lot of previous economic theories. Some of the reasons for such low inflation could be but not necessarily limited to:
1) Low energy prices
2) China and other countries exporting deflation to the rest of the world (manufactured goods)
3) Higher productivity and constant exportation of many lower end jobs.
A low unemployment rate should theoretically raise wages but in our new economic paradigm so many jobs can, optionally, be exported or out-sourced. It puts a new damper on just how much low employment can stoke higher wages which normally would – but currently is not – fanning inflation. Official unemployment is low but it can be argued and I tend to agree that under-employment is too high (people settling for lower level jobs than their training would have normally commanded). For a more detailed explanation of the decoupling of inflation with low unemployment please check out: The Phillips Curve Is Dead: Why Lower Unemployment No Longer Causes Inflation.
If QE is the gas pedal then QT is the brake equivalent. Why not just keep the foot on the pedal and not apply the brakes at all? If one drove a car that way, it would eventually crash which represents a good analogy for the US and global economy. Here is a good chart which is flashing warning signs at us right now:
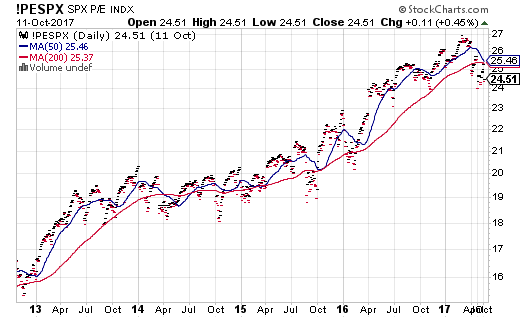 This shows the P/E (stock price per earnings per share) ratio of the S&P 500. We are now above 25, giddy elevations -higher than the ratio that preceded every stock market crash in the last 100 years with the exception of the 2001 dotcom bubble burst.
If I were Janet Yellen I would probably be checking off the following boxes: (I am sure she has way many more boxes than I do but for simplicity sake, here are the main ones)
Positives
1) Economy is growing.
2) Unemployment is low (though in reality as mentioned above Under-employment is probably still high).
3) Though tame and not as high as we want, the US has so far managed to stoke the fire of some inflation (the consensus is an inflation rate of 2% or a little higher is just the right amount). The average for the last 12 months thru August 2017 has been 1.9%.
Somewhat Positive but Getting Concerning
4) Stock market at giddy P/E ratios still rocketing upward.
5) Bond prices high with yields historically low which translates into very low mortgage interest rates. This in turn has been fueling the real estate market to the point where it may be getting a little too hot especially here in Hawaii. For a full analysis please see Sept 2017 Statistics & Analysis.
Though the Economy is growing again, it would be better if the gains were a result of higher productivity and lower under-employment rates (as opposed to lower and politicized unemployment rates which we have already). Higher stock market gains and a vibrant real estate market alone do not underpin a healthily growing economy which – in reality – requires a bedrock of higher earnings, higher productivity and then higher wages to truly sustain it. QE has been a big injection and IV adrenaline infusion – effective so far – but now it is time to ween ourselves off it.
The trick for Janet Yellen and the FED now is to successfully remove the bloated M3 Money Supply (as a result of QE) by reducing the FED balance sheet via QT without crashing the economy. So far it has been announced that the FED will start slowly in October with only $10B in bonds and mortgage back securities to roll off the books at first (meaning the $10 billion will not get reinvested). The amount rolling off the books every month would slowly increase on a wait-and-see basis. The best case scenario would result in slightly lower bond prices with slightly higher yields and mortgage interest rates (but not too much). The stock and real estate markets would cool off a bit (but still stay warm). If the US congress could pass some meaningful tax reform we may just get some higher corporate earnings (that would also help with the giddy P/E ratios) and higher productivity as opposed to the corporate stock buy-back binge gains. On the other hand, if the QT brakes are applied too hard everything could come down crashing!
Perhaps one could expand on the sailing and Columbus navigation analogy described above to a jet threading a needle needing to get the pitch, roll and yaw just right to make it thru without crashing – the economy. Seat belts strapped in, hang on tight and stay tuned to the Hawaii Damon newsletter as I’ll be giving updates on how flight QT is coming along!
Please note the 2nd Part of Hawaii Damon Newsletter covered CAP (capitalization) Rates. Investors, you will not want to miss this one so please check it out here!
Aloha!
Damon Rhys